Welcome to Exam Notes by CertBlaster! This is our free study guide Network Plus 5.2 and in this installment, we will examine the topics covered in objective 5.2 “Given a scenario, use the appropriate tool.” We will cover hardware, software and command line tools, and utilities. Enjoy the Free study guide Network Plus 5.2!
Crimper
CAT 5 and CAT 6 can use the same crimping tool. Just be sure to match the cable ends against each other and the wiring standards. Your typical crimper will do all RJ cable terminations.
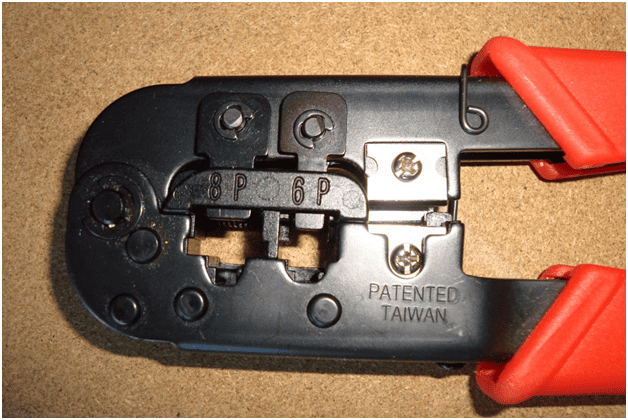
Crimper
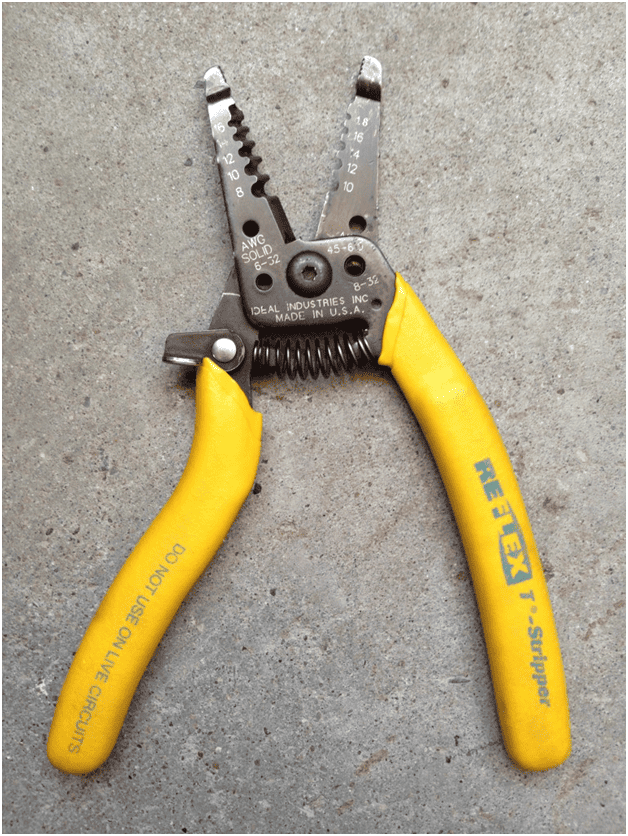
Cable stripper
With a specialized notch for each relevant wire gauge, this device can cut through the insulation only while leaving the copper core of the wire intact.
Coax stripper tool
Multimeter
Multimeters can be analog or digital. Analog meters are designed to test continuity positive AC and negative voltages as well as resistance. The display is typically a needle over a gradient background with the needle resting on the value being measured. An analog Multimeter can be damaged by extreme under-voltage or overvoltage which would damage the delicate internal windings. Digital Multimeters address this problem by auto-ranging themselves into the volt/amp range that would provide a relevant output or displaying an error message.
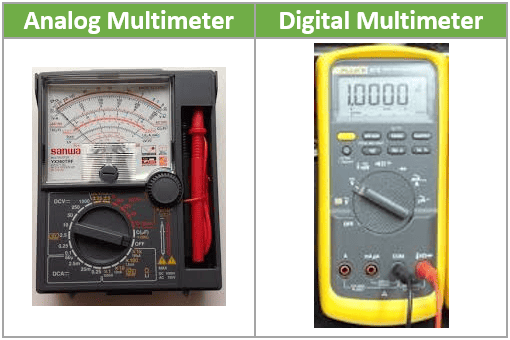
Multimeters
Tone generator & probe
Using a tone generator and probe, cables can be traced and followed end to end through some seemingly impossible bundles. One device is useless without the other. In operation one wire has a tone applied to it at a frequency readable by the probe, it will produce an audible signal. This assures that if you have tone on your cable at the destination, it’s the right one.

Toner probe
Cable tester
An indispensable tool for network diagnostics your cable tester can diagnose wiring problems from broken/cut cables, loose wires to crossed pairs. Less expensive than a network Multimeter, this tester is often all you need to fix a connectivity issue. Place the Master on one end of the suspect cable and the Remote on the other end. The light display will show each wire sequentially. Any sequence problems can be usually be attributed to a crossover cable in the line, Find that and replace with T-568A or T-568B depending on the installation.
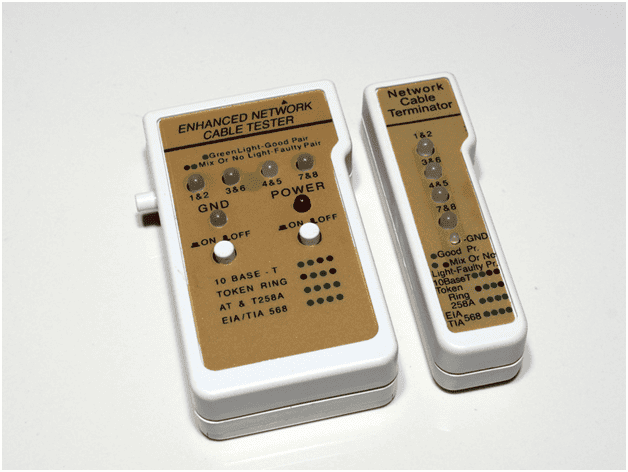
Cable tester
Loopback Plug
A loopback plug can be used to test any port on a PC or router or switch. Now it is used most commonly to test the operation of a physical network interface card port. The device typically uses software to send and receive data thereby validating or invalidating the port.

Loopback plug
Patch Panel
Patch panel wiring closets represent some of the most challenging situations for a network technician. Every cable going to every wall jack in the area terminates here. In some cases you have only to connect an RJ-45 jack to a numbered port. In others you have to run 8 wires to their correct locations on the patch panel. Here is an example:

Patch panel
Punchdown tool
In the graphic above each individual wire must be solidly placed into position. This is where your punchdown tool comes into play.
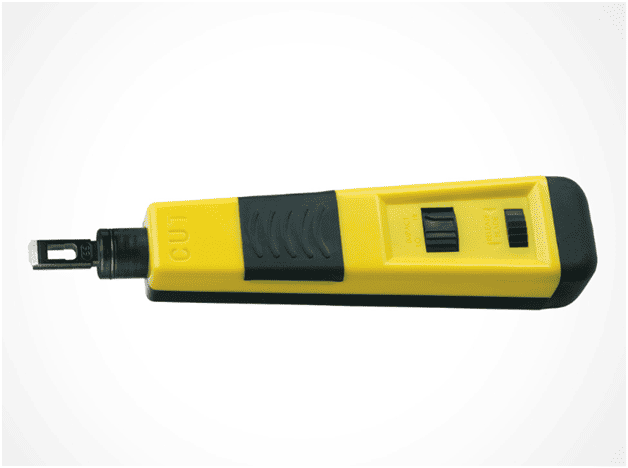
Punchdown tool
This tool is designed with a recoil like a mechanism to firmly punch the wire into position and to trim off excess wire. One-click and you’re done.
Spectrum Analyzers can be used to optimize the performance of your network. They range from the simplest “How many bars are you getting?” to multicolor spectrum analysis of the wireless environment. Suffice to say that this tool is a useful diagnostic. Keep in mind that wireless signals are measured in dBm and is always expressed as a negative value, making -25 dBm a stronger signal than -90 dBm. Use devices to avoid channel overlap.
Light meter
A cable performance tester with fiber optic capability will contain a light meter to measure the state of the fiber connection,
OTDR
An OTDR (optical time domain reflectometer) transmits a signal and analyzes the reflected signal. It can measure the length of the cable and measure the power of the light signal. The OTDR can accurately detect the distance to optical flaws in the path like bad connections and bends or kinks.
Packet sniffer
Also known as a Protocol analyzer, this tool allows you to view each frame traversing on your network. The source, destination, protocol and related statistical information. Protocol analyzers can be hardware or software. In the example we show a portion of the output of the Wireshark protocol analyzer software. Here the packet itself is listed and its information is displayed as text. The packet contents are displayed in hexadecimal.
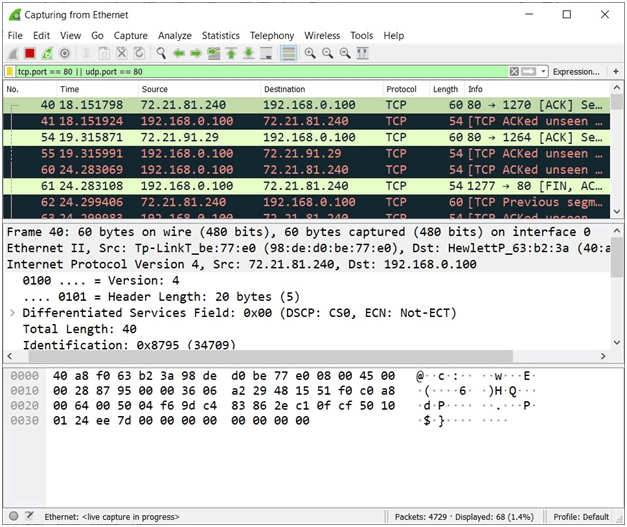
Wireshark
Port scanner
There are several popular port scanners. Two widely used port scanners are Nmap which is command based and the Zenmap program adds a graphical interface to Nmap along with network topology mapping capabilities. In this example, we used Zenmap to scan the local host for open ports.

Zenmap
WiFi analyzer
WiFi Analyzers can be used to discover a problem, and more importantly, optimize the performance of your WiFi network. They range from the simplest “How many bars are you getting?” to multicolor spectrum analysis of the wireless environment. Suffice to say that this tool is a useful diagnostic. It is available for free from your wireless provider’s site and will run on your smartphone. Keep in mind that wireless signals are measured in dBm and is always expressed as a negative value, making -25 dBm a stronger signal than -90 dBm. Use devices to avoid channel overlap. In the example, you can see the crowded 2.4GHz band followed by the 5.0 GHz band. This information allows you to locate overcrowded channels.
2.4 GHz |
5.0 GHz |
Bandwidth speed tester
Most of us are familiar with the service providers bandwidth statements. ISPs host online speed test sites to enable you to check your actual performance online. The tests are also available as apps. You can configure the app to test your company’s LAN or WAN. You’ll see that the upload and download speeds vary over the course of a day. You can schedule the tests to run automatically and analyze the usage.
 |  |
| Ookla Online Speed Test | Ookla App |
Ping
As your first network troubleshooting tool, the ping command returns a very detailed representation of the connection being tested. In our example, we ping the Google DNS server. This sends four 32-byte ICMP packets to the target and displays the results. Looking at the graphic you can see if any of the packets were lost and the time it took to receive the response. The information is presented in a format that displays the results for each packet and the average RTTs (Round Trip Time). Some routers do not respond to these ICMP requests and will show as an asterisk (*) in your results.
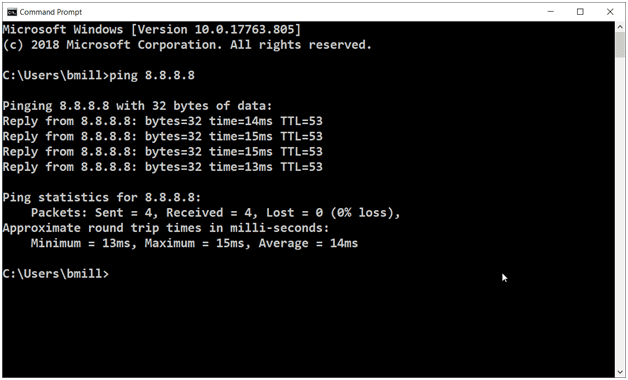
Ping at the Command Prompt
tracert, traceroute
Let’s look at an example where you suspect your traffic is experiencing slow response times. The next command line utility we’ll use is tracert (Windows) or traceroute (Linux). We will use the same target; Google’s DNS server and the utility will gather the statistics from up to 30 hops. A hop is a link from one router to the next. Looking at the output you can see that there is a significant delay between the first and second hops and the fifth and sixth. Windows devices send ICMP packets to the destination. The routers in the path respond to the ICMP request and the details are displayed. Some devices do not respond to the ICMP request but will still forward the packet.
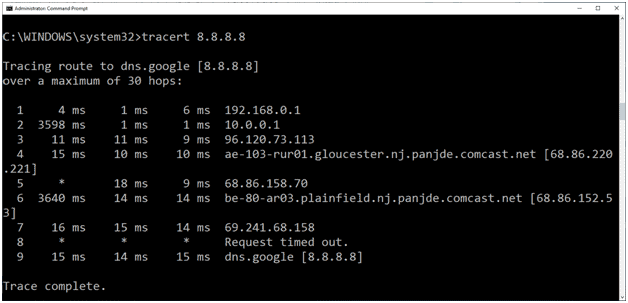
Tracert at the Windows Command Prompt
pathping
The pathping command uses both the ping command and the tracert command. Multiple ICMP packets are sent to each hop and the statistics are monitored over a short time period then compiled into a report. The result of the command provides useful information about network conditions like latency and packet loss.
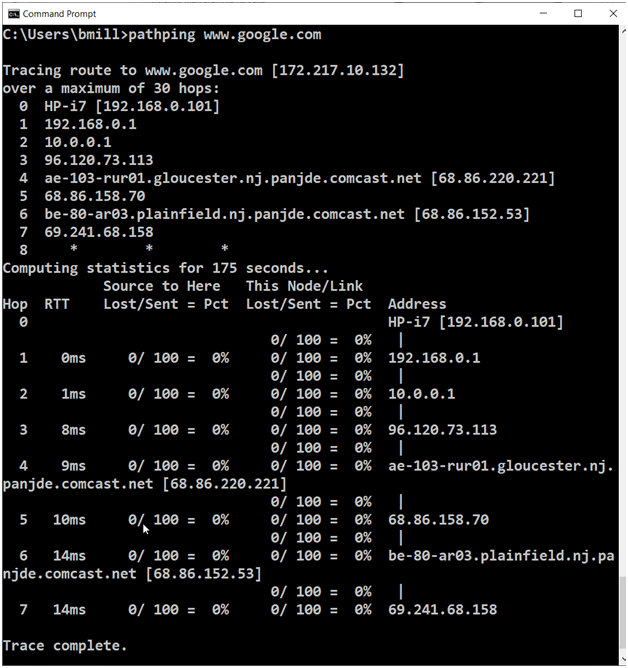
pathping
Nslookup / dig
These next commands, nslookup and dig enable you to obtain the name to address information stored on your DNS server. At the Command Prompt entering the command and a web address or an IP address will produce the results shown in the nslookup example at the right below. In Linux we use dig and the FQDN to produce these results.
 |  |
| Nslookup | dig |
Ipconfig / Ifconfig
When troubleshooting a network problem, you want to validate your IP connection first. Your basic IP configuration can be viewed with the ipconfig command. You’ll see your IPv4 and IPv6 addresses, subnet and default gateway of the adapters on your machine. More detailed information like the MAC address and DNS server are displayed are shown in the example using the ipconfig /all command. On Linux devices the ifconfig command is used.

ipconfig
iptables
On Linux devices iptables provides stateful packet filtering in the kernel. Iptables can be used effectively as the firewall between your internal network and the internet.
netstat
The TCP/IP statistics on a host can be viewed with the netstat command. Netstat is capable of displaying all connections their state and the ports they are running on. When used alone netstat displays all connections. This is usually more information than you need and command options can be used to find what you are looking for sorted by protocol with the -s option and the hosts routing table is displayed with -r. All command options can be displayed by using netstat /?. The routing table can also be viewed using the route command.
arp
The Address Resolution Protocol (ARP) maintains a table of hardware (MAC) to IP addresses. The arp command enables us to view and maintain the contents of the routing table.
tcpdump
Classified as a packet sniffer the tcpdump command is used on Linux devices to capture all tcp traffic on a network interface. This requires root or administrative privileges. There is a great deal of data generated so it is wise to save the output with the -w option and a filename. This will enable you to better review the output.

tcpdump
Well, that’s all for objective 5.2! We hope you enjoyed the free study guide Network Plus 5.2. Remember to review each of these topics to deepen your understanding. Good luck. See you in 5.3.

